Track your dividends in 7 steps: A step-by-step guide to track your dividend income and create your own dividend tracker spreadsheet.
I have been tracking my monthly dividend income on this blog since 2017.
These reports chronicle the growth of my dividend income on the way to financial independence.
To track my dividend income and to make the content more visibly appealing, I create spreadsheets using Apple Numbers.
I find that using a spreadsheet to track your dividends is a fun way to follow your progress.
In this post, I will show you how to create a spreadsheet to track your dividends in 7 simple steps.
Let’s take a look at the steps.
How to Track Your Dividends

Track Your Dividends in 7 Steps:
1. Decide on a Spreadsheet
The first step is deciding on which spreadsheet company you want to use.
For the record, this post will not teach you how to use Microsoft Excel. But I included three Youtube links below if you are new to spreadsheets.
Personally, I use Apple Numbers to create spreadsheets because my personal computer is a Macbook.
So based on your hardware and software preferences, and based on your skill level, pick a spreadsheet.
Your options are Google Sheets, Apple Numbers, or Microsoft Excel.
Once you decide on a spreadsheet, it’s time to move on to setting up your dividend tracker.
If you are not familiar with how to use a spreadsheet, I would recommend searching YouTube or searching online for a free tutorial.
Here are a few spreadsheet tutorials to check out on YouTube:
Microsoft Excel Tutorial – Beginners Level 1
Apple Numbers for Mac, iPad, iPhone
Google Sheets Tutorial for Beginners

2. Create The Framework For Your Dividend Tracker – Insert Stock Details
In step two, you need to create the framework for your dividend tracker.
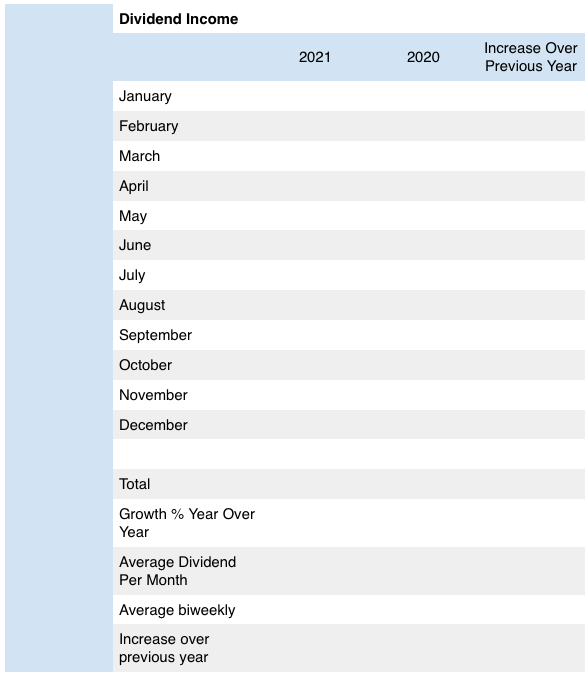
Essentially, you need to create a spreadsheet that includes the main categories. For example, your dividend tracker should include the month, year, total income, and last year’s income to compare growth. (example shown above)
Depending on how much time you want to spend, you can either build your own spreadsheet or you can export your portfolio data from your broker and build out from there.
Because I have many connected charts, I built up my own spreadsheets and inserted the stock data individually. It takes longer, but it allows you to customize your dividend tracker exactly how you want.
3. Build Out Other Categories For Data You Want To Track and Design It How You Want
After the framework to track your dividends is set up, you get to customize your dividend tracker exactly how you want.
Additionally, you can create separate spreadsheets to track specific portfolio details.
I also track my monthly average dividend income and my bi-weekly dividend income. In turn, I created additional spreadsheets to track that data.
For example, I have a chart that tracks all dividend stocks and total expected dividend income in the next 12 months. These types of charts appear in my quarterly dividend income projections.

I created a chart that documents how much dividend income is added monthly.
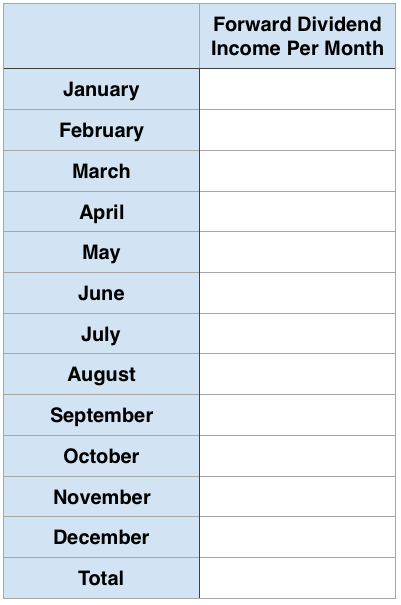
And I created a chart that tracks how much dividend income is expected monthly.

Furthermore, I have a chart that tracks my annual total return with dividend income, capital gains, and interest factored together.

Once all your charts are set up, you can design them how you want. Add the colours and chart styles you want.
4. Review Your Transaction History in Your Brokerage Account for Dividend Payments
Now that your dividend charts are set up, it’s finally time to input your dividend income numbers.
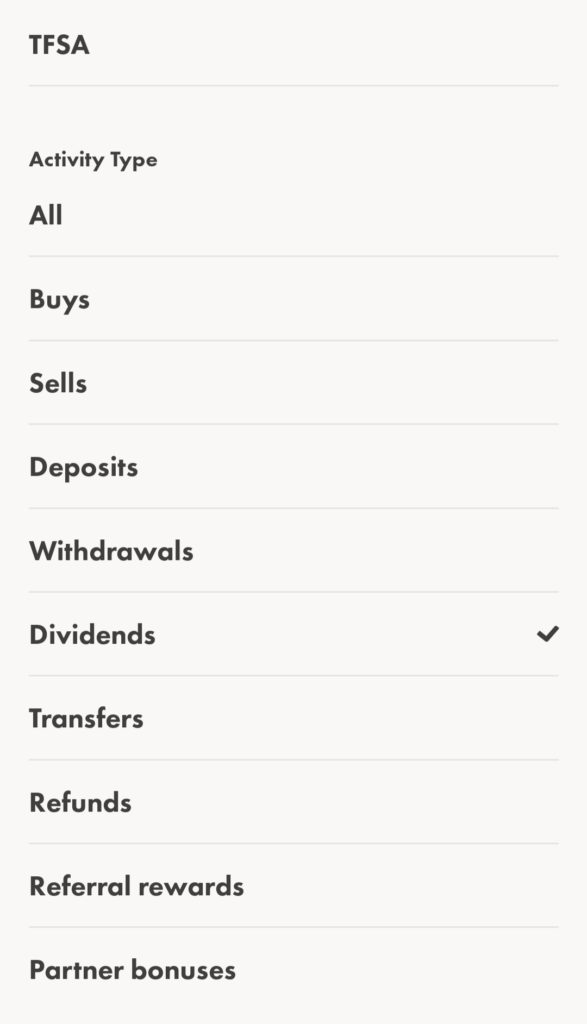
To do this, sign on to your brokerage account and visit the transaction history or activity section.

Most brokers will allow you to filter by dividend and time frame.
I usually look at dividend income received in the past 30 days.
5. Insert Dividend Payment Details
As you are reviewing your transaction history, you can manually insert the data into your dividend tracker.
Of course, it depends on how you set up your charts, but they should start to look like my dividend income chart examples.
Alternatively, if you are tracking forward dividend income, you will be able to visualize how much money your stocks will generate annually.
6. Set Up Formulas
To track your performance, there are just a few simple formulas you will need to know.
You don’t have to be an expert to set these up.
To set up your formula, in most spreadsheets, press the “=“ sign and then enter your formula.
Or, you can click the “insert” button and choose the appropriate formula.
To track your YoY growth compared to last year’s dividend income, use this formula:
= (dividend income – last year’s dividend income)/last year’s dividend income
For example, I earned $621.28 in 2020 from dividends and $571.77 in 2019. To calculate the rate of growth using the formula above, it would look like this: =(621.28 – 571.77)/571.77
That will show you the percentage of increase or decrease compared to last year’s income. And you can use that same formula for each individual month.
Please note that your total investment return is a completely different formula.
7. Update Your Spreadsheets Once Per Month
Once your dividend tracker spreadsheet and the formulas are set up, you just have to review your transaction history once per month to update it.
I recommend updating your spreadsheets once per month so you don’t get too far behind.
Plus, it will help you be aware of any changes in your portfolio.

Track Your Dividends – Final Thoughts
Besides creating your own spreadsheets to track your dividends, you could do a Google search for an online spreadsheet creator.
Although I have not tested an online spreadsheet creator, I’ve heard that it’s easier. You just enter in the data and charts are created for you. However, on the downside, you probably have to create another online account.
As such, I prefer creating my own charts because I can customize them exactly how I want.
Let me know if you track your dividends differently in the comments.
Related post
Best Stock Apps: (4) Must-Have Apps for Tracking Stock Prices
Forward Dividend Income Projections
I am not a licensed investment or tax adviser. All opinions are my own. This post may contain advertisements by Monumetric. This post may also contain internal links, affiliate links to BizBudding, Amazon, Bluehost, and Questrade, links to trusted external sites, and links to RTC social media accounts.
Connect with RTC
Twitter: @Reversethecrush
Pinterest: @reversethecrushblog
Instagram: @reversethecrush_
Facebook: @reversethecrushblog
Email: graham@reversethecrush.com


 Should You Invest In Bitcoin?
