Blog income report July 2021: Sharing how much blog income was earned, detailing website traffic, and discussing marketing strategies. This post contains affiliate links.
My long-term goal is to become financially independent through blogging and investing.
Once I achieve that goal, I can spend more time on blogging and investing. I will spend my days thoroughly analyzing stocks and allocating capital. When I’m not doing that, I’ll be documenting the journey on this blog.
To chronicle the journey to financial independence, I publish monthly income updates.
The following is a blog income report for July 2021.
In this report, I will share my blog income, website traffic, and marketing strategies for the month.
Let’s dive in.

Blog Income Report July 2021 — Highlights
- $83.98 was earned from blogging in July 2021
- 38% increase over blog income earned in June 2021
- Month-over-month display ad income increase by 1.75%
- $61.75 CAD generated by Monumetric display ads
- 1 affiliate sale made worth $22.23 CAD
- Net profit of $23.84
- Organic search traffic increased by 378.59% over June 2020

Blog Income Report July 2021 — $83.98
I earned $83.98 from blogging in July 2021.
This represents a 38% increase over the $60.69 that was earned in June 2021.
Income increased because another affiliate sale was made, and due to a slight increase in Monumetric display ad income.
Month-over-month display ad income increased by 1.75%.
Below is a more detailed look at this month’s blog earnings.
Blog Income Earnings Breakdown
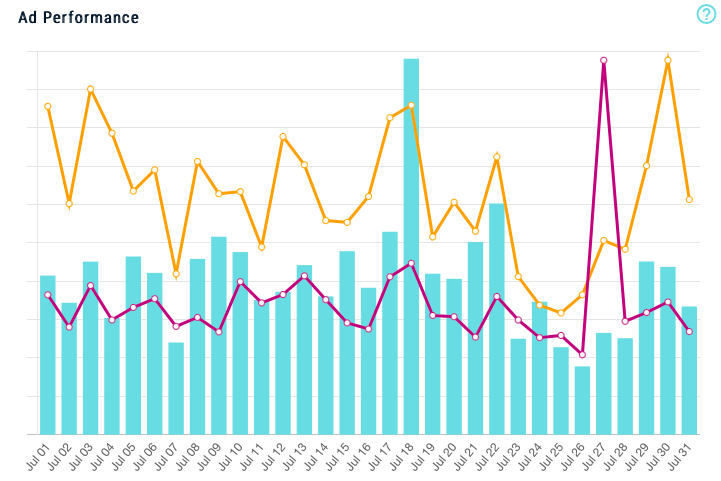
Monumetric (Display Ads) — $61.75 CAD
Bizbudding (affilate) — $22.23 CAD
Total revenue — $83.98 CAD
Net profit — $23.84 CAD
Blog Expenses Breakdown — $60.14
I spent a total of $60.14 on the blog in July 2021, which was just slightly higher than last month.
In truth, my expenses didn’t really change at all. The reason for the increase is currency conversion from CAD to USD to pay for expenses.
Otherwise, I spent money on the same three items as last month: web hosting with Bluehost, Canva Pro, and Ubersuggest. I use Canva Pro for marketing the blog, and Ubersuggest is a keyword tool that helps with search engine optimization.
Overall, July 2021 was a positive month for blog income, because Monumetric display ad income increased, and another affiliate sale was made.
More importantly, the blog generated a net profit of $23.84.
I was able to cover all my expenses and have money left over for reinvestment.
As such, 10% or $8.41 of the total blog revenue was saved in a brokerage account. I reinvest 10% of blog income into dividend stocks to earn dividend income on blog income. This account is a small non-registered account, but it’s slowly starting to grow.
As for the surplus that was left over, it is sitting in a more accessible account that I use to pay for blog expenses. Fortunately, this account has been growing each month as well because the blog has been profitable.
Albeit, it’s a small amount of money. But it’s really cool to be able to cover my blog expenses and reinvest in the blog in other ways as the income builds up.

Blog Expenses Breakdown
Ubersuggest — $29.00
Canva Pro — $16.99
Webhosting — $14.15
Total — $60.14
Money saved — $8.14

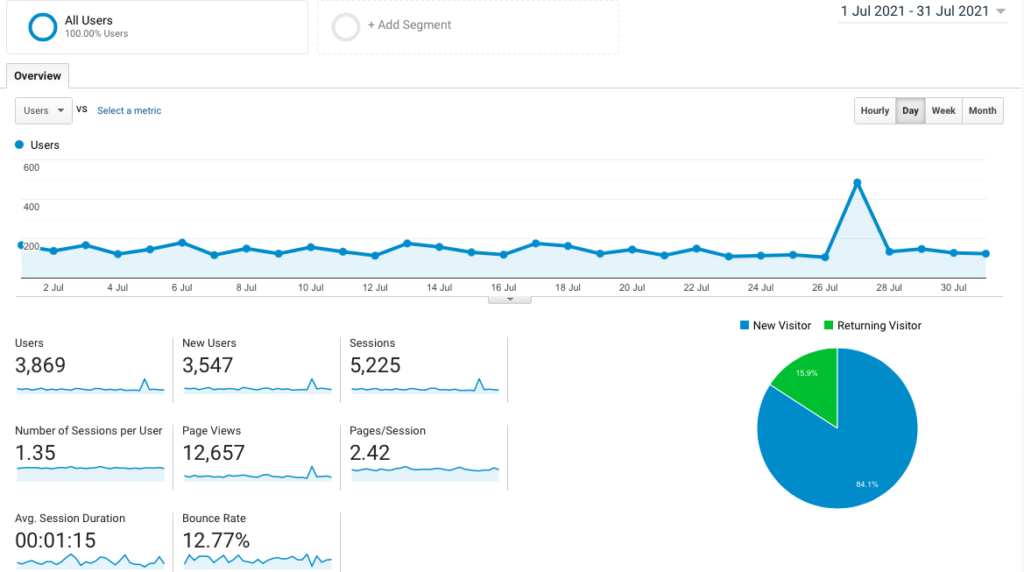
Website Traffic — Blog Income Report July 2021 – 12,657
Although blog income was up over the prior month, pages were down slightly compared to June 2021.
However, it doesn’t make sense to compare traffic to the prior month. It makes sense to compare performance to the same month during the prior year.
Compared to June 2020, page views were up by 1,799 or 16.57%.
This is not a huge amount of growth. But it’s growth during the summer, which is a down season for blogging. Simply put, people are outside more, as they should be. Consequently, they are online reading blogs less.
In spite of the modest growth, there is a lot to like about this month’s performance.
For instance, the number of sessions increased by 85.81%, and organic search traffic increased by 378.59% compared to June 2020.
In addition, the number of users increased by 103%, which means more people are visiting the blog overall.
All data is from Google Analytics.

Website Marketing Strategies — How Traffic Was Generated
I have always been fascinated by marketing strategies to attract eyeballs to a product or service.
So, it’s neat to be able to look at the different ways that website traffic is being generated.
As a marketer, it’s fun to test different marketing strategies out to see how they affect website traffic and income.
Ultimately, this is why I blog my website traffic.
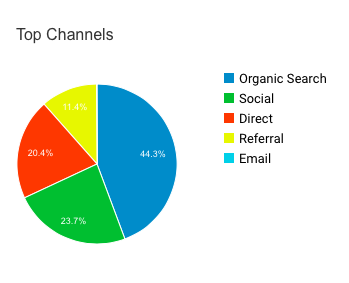
As per usual in 2021, organic search traffic dominated my website traffic in July 2021. 44% of my total traffic was from organic search during the month.
Social media was the second top traffic generator in July 2021, as it accounted for 23.7% of total website traffic.
Of the social media traffic, Twitter led the way, as it accounted for 64% of my total traffic.
Meanwhile, Facebook generated the second most social media traffic, as it accounted for more than 24% of all social media traffic. Frankly, this is surprising because I don’t even focus on it. Facebook is potentially an area of opportunity to increase social media traffic.
The rest of my social media channels, Pinterest and Instagram, generated around 3% or less of total traffic.
Content In July 2021 — 14 Posts Published
I published a total of 14 blog posts in July 2021, but I had some help.
Marjolein from Radical Fire published an excellent guest post on how paying off your mortgage early may give you fewer options.
The main thing was that I maintained my 3-posts-per-week schedule throughout July 2021.
Admittedly, it is more challenging to maintain this schedule during the summer. My hours are up at work and I like to be outside more and go on road trips.
To counter this, I usually have posts scheduled one month in advance. But my time off and summer aloofness is beginning to catch up to me.
Nevertheless, I published the following 14 posts in July 2021:
Percentage Of Income Saved June 2021 — 32%
Watchlist For Stocks — A Must-Have Tool To Monitor Investment Opportunities
Benefits To Saving Money: 12 Incredibly Positive Reasons To Save
Best Finance TV Shows: 8 Shows To Quench Your Money Thirst
How To Buy And Sell A Stock: The Basics OF Executing Trades
What Is The Ideal Age For Early Retirement?
Investing With $10,000: How To Invest 10K Into Stocks
How To Know When To Sell Stocks: 7 Scenarios To Know When to Sell And When Not To Sell
Blog Income Report For June 2021 — $60.69
Save Money Around The House: 7 Eco-Friendly Ways To Spend Less
Podcasts On Blogging: 5 Podcasts To Go From Hobbyist To Full-Fledged Career
How To Dollar Cost Average: 7 Tips To Turn Investing Into A Habit
Dividend Income June 2021 (New Record)
Social Media And Email Subscriber Growth in July 2021
Social media accounted for a 23.7% of total website traffic in July 2021, which was slightly higher than in June 2021.
Most of the traffic was from Twitter, which generated 64% of social media traffic.
I’m glad it worked out this way, because Twitter is my favourite social media network overall. I’m beginning to focus on personal finance content the most on this channel.
Otherwise, I look at social media mostly for branding. I don’t even expect Instagram to generate a lot of traffic.
Of course, Facebook could be an area of opportunity, as it is already my second highest social media traffic channel without putting much effort into it.
As for Pinterest, it continues to be an area of opportunity for website traffic. But it hasn’t been performing that well this year.
Fortunately, though, all social media channels continued to grow. Thank you to everyone who subscribes or follows, I sincerely appreciate it.
Here is a breakdown of my social media and email subscriber growth in July 2021
Data is as of August 13, 2021 compared to last month
Twitter – 3,524 followers (Up 58)
Pinterest – 1,646 followers (Up 21)
Instagram – 789 followers (up 42)
Facebook – 119 followers (Up 3)
E-mail subscribers – 434 subscribers (Up 12)
Total RTC audience: 6,512 (Up 136)
Total comments published: 3,786 (Up 101)
Thank you to everyone who subscribes, follows, comments or takes the time to engage. I appreciate it and hope to share an exciting dividend growth journey with you over the next 10 years.
Goals For August 2021
For the most part, I accomplished the blogging goals I set for July 2021.
I might some tweaks to the e-mail subscription list, I published at least 13 posts, and I published a guest post.
I’ll be honest, though—I took it easy in late July and I have been taking it easy in early August.
I went on a couple brief road trips, mainly to go to a beach. Unfortunately, the weather wasn’t the best for the beach. But it was fun just to drive around and explore.
Anyways, those road trips put me 4 days behind. Normally, I aim to write 2 posts per day on days I’m off work.
So, for August 2021, I am going to be realistic with my goals. I am going to try to enjoy the outdoors and take into account that my hours at work are up. But I also want to continue the same pace and not fall behind.
Basically, I’m only looking to maintain my posting schedule in August 2021. If I can achieve that, I will be satisfied.
To be more specific, my goal is to write 11 new posts. Based on the fact that I have 5 days off this month after today, my goal is to write 11 blog posts. This number includes this blog income report July 2021. Ideally, I will write two posts per day off and then one post today (the day that I was off). However, if something comes up, I may take the opportunity and miss this target.
Otherwise, I’m going to be enjoying the summer a bit more and focusing on investing.
Once the fall sets in, I will begin to step up the work intensity again.

Blog Income Report July 2021 – Final Thoughts
Overall, I share my blog income report to chronicle the journey of this blog.
In summary, I made $83.93 from blogging in July 2021.
This was a 38% increase over my June 2021 blog income.
The increase can be attributed to a 1.75% month-over-month increase in Monumetric display ad income, and a Bizzbuding affiliate sale.
If I combine my dividend income and blog income in July 2021, I earned $137.78 in total passive income.
Of course, I am extremely grateful to receive enough money from blogging to cover the cost of it. I get to do something I love and get paid for it. I hope that others find these reports helpful.
Thank you for reading, subscribing, commenting, or following on social media.
How was your blog traffic in July 2021? Did you find that traffic dips in the summer?
Other Blog Content To Check Out
Blog Income Report June 2021 — $60.69
Blog Income Report May 2021 — $233.03
How To Blog: 8 Blog Tasks With The Highest ROI
Monumetric: A Simple Way For Blogs To Earn Monthly Income
I am not a licensed investment or tax adviser. All opinions are my own. This post may contain advertisements by Monumetric and Google Adsense. This post may also contains internal links, affiliate links to BizBudding, Amazon, Bluehost, and Questrade, links to trusted external sites, and links to RTC social media accounts.
Connect with RTC
Twitter: @Reversethecrush
Pinterest: @reversethecrushblog
Instagram: @reversethecrush_
Facebook: @reversethecrushblog
Email: graham@reversethecrush.com


 The Problem Of Retirement Planning – A False Sense of Security
