Notes on blogging after 1.5 years and the June Blog Report – Detailing my blog traffic and social media after 1.5 years of blogging
Based on the blogging reports and dividend income updates published on this blog, it may appear like my ultimate dream is to become a Dividend Investor & Blogging Analyst.
For whatever reason, I like to create blog reports and track statistics.
In fact, I anticipate that the majority of my early retirement will be spent working as an investor and blogging analyst.
Be that as it may, I’ve still got a long way to go in order to earn enough money from my dividend portfolio to support blogging full time.
Notes on blogging after 1.5 years and the June Blog Report
It’s almost bizarre how much changes after blogging for more than a year.
Unfortunately, a lot of bloggers quit after the first 6 to 12 months due to unrealistic expectations.
But if you continue blogging for more than a year, it’s as though your blog has reached a magic threshold. In my own experience, shortly following the one year mark, I began receiving guest post and freelance inquiries like clockwork.
Regarding the freelance and sponsored work, I received income for writing and including links on an article that was published on this blog in 2016.
Additionally, I received income for publishing a post which I did not write.
Both experiences were completely random and were in no way lobbied for, and both transactions were completed through PayPal.
Since those two freelance opportunities occurred, I began working so I have not been able to collaborate on any other paid projects from blogging.
Blog Traffic Shift
It’s interesting to watch the shift in how traffic is generated. In the early days, it was all based on hard work — how many comments I left on other blogs, how many blog posts were published per month, and how active I was on social media. However, nowadays, I only publish around 3 to 4 times a month and generate close to as much traffic as I did early on when I was publishing a lot more content. The traffic is now easier to attain because of larger social followings and organic search traffic.
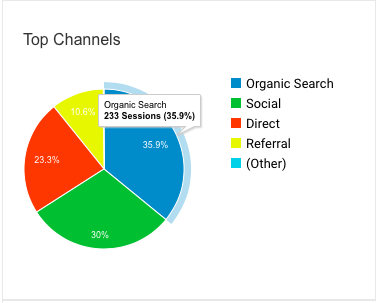
For an example of the shift in traffic, you don’t have to look much further than this very post. As you’ll see from the Acquisition Overview below, organic search traffic was the biggest contributor to page views in July, and that’s exactly what I want.
Let’s get into the report:
[bctt tweet=”Blog Report Traffic, Acquisition Overview, and Social Media Growth for June 2017″ username=”reversethecrush”]
Blog Traffic
compared to May 2017*
All time page views on Reverse the Crush — 41,783 (Dec 1, 2015 to June 30, 2017*)
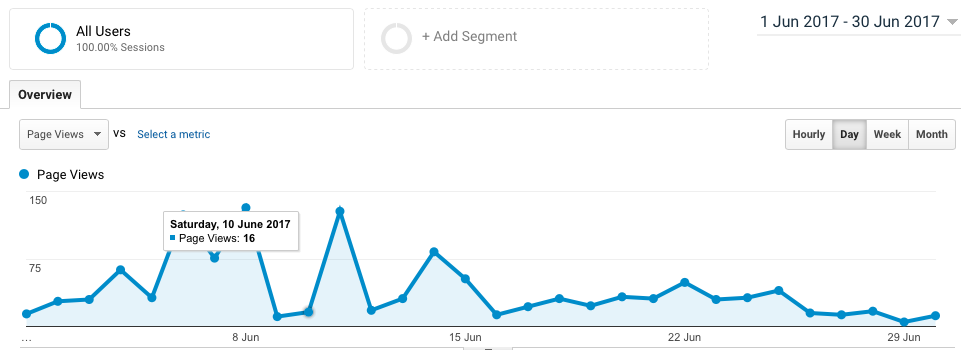
Page views in June — 1205 (Up 404 | 50.44% increase)
Total users in June — 432 (Up 191 | 79.25% increase)
Total sessions in June — 649 (Up 266 | 69.45% increase)
All time blog posts published on Reverse the Crush — 188 (as of July 15, 2017*)

Acquisition Overview
Blog Traffic breakdown ranked in order and compared to May 2017*
Organic Search — 233 sessions (Up 115 | 97.46% increase)
Social — 195 sessions (Up 59 | 43.38% increase)
Direct — 151 sessions (Up 51 | 51% increase)
Referral — 69 sessions (Up 40 | 137.93% increase)
Other — 1 session

Social Media & Email Subscriber Growth
compared to May 2017*
Twitter — 1820 followers (Up 7 | 0.39%)
Pinterest — 384 followers (Up 7 | 1.86%)
Google+ — 15 followers (no change)
Email Subscribers — 37 subscribers (Up 1 | 2.78%)
Thank you to everyone that subscribes or follows!


 Development Notes and Goals for July 2017
