Finance Projections as of August 1, 2018
-
$13.30 of annual dividend income was added since the last report.
-
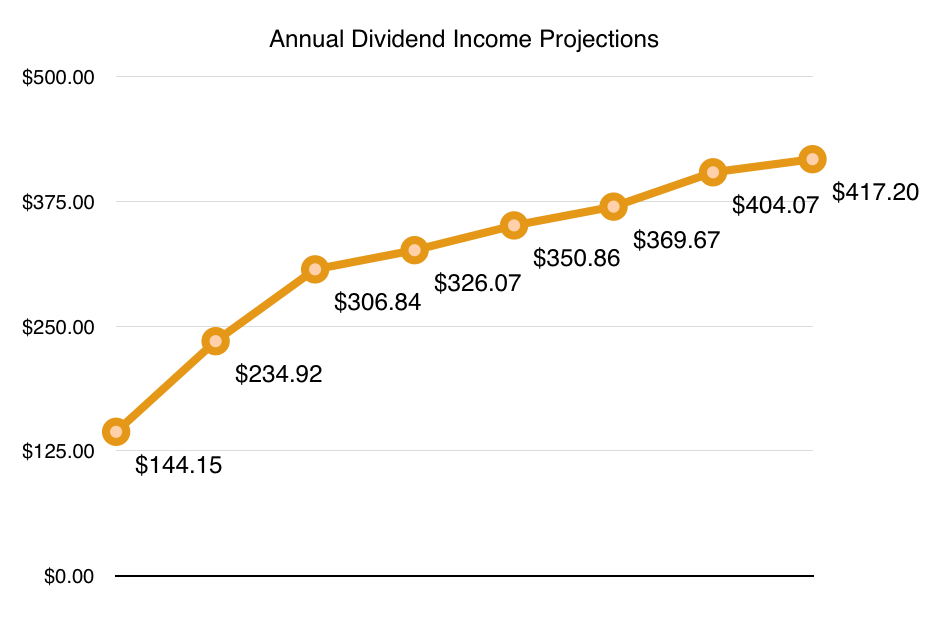
Total dividend income projected is $417.20 annually.
-
The RTC Dividend Portfolio now generates $188.31 more than last year.
At the beginning of each month the RTC portfolio manager tallies up the dividend income totals to find out how much income was added.
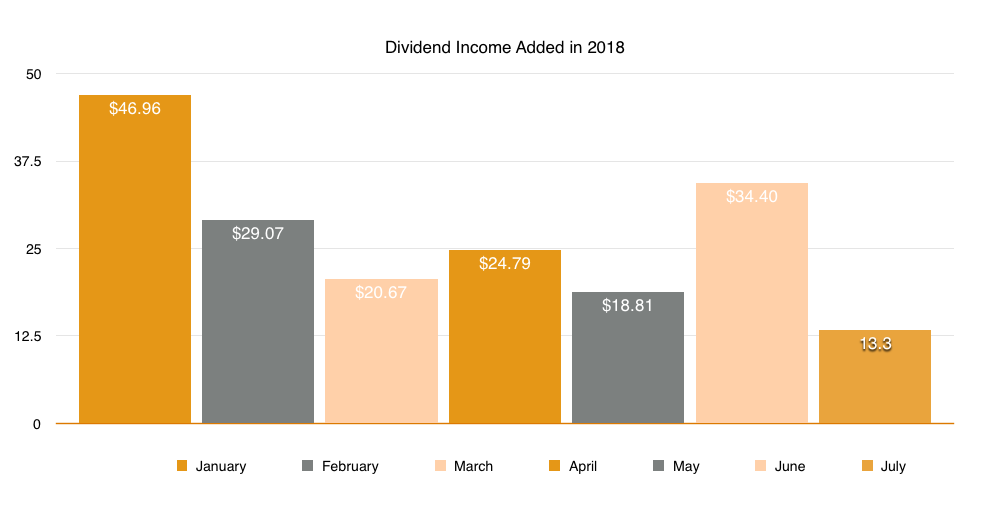
Overall July was less active when compared to June. A total of $13.30 was added while $34.40 was added in June. However, a lesser increase was anticipated because there was not as much new capital to invest.
For the record, investment capital is obtained through personal savings and through dividend income payments. As you can see from the chart below, the RTC portfolio generates an average of $34.77 per month. It may not seem like much but it’s enough to contribute to new purchases.
To illustrate the growth of the past year, $34.77 is enough to cover my coffee expenses every two weeks. When I began this journey a year ago, I was only able to afford 2 coffees per month from dividend income payments.
Below is a report on dividend growth since the last report was published on July 11, 2018.
[bctt tweet=”Finance Projection: $417.20 annually | Forward Dividend Income Projection #8″ username=”reversethecrush”]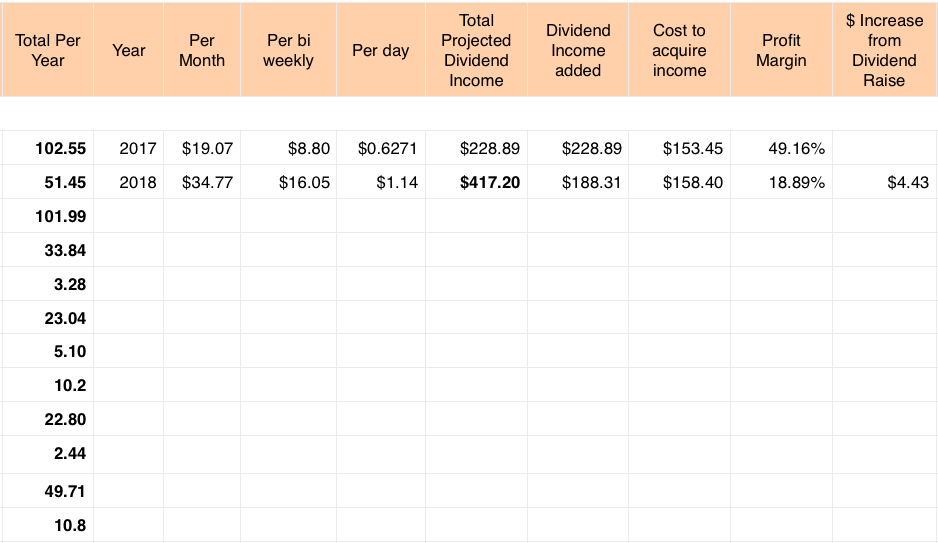
Finance Projection #8 – Dividend Income Numbers for August 1, 2018
Number of businesses owned: 11
Total annual dividend Income projected: $417.20 (Up $13.30 since the last report | Up 3.29%)
Average dividend income projected per month: $34.77 (Up $1.10)
Projected Bi-weekly dividend income: $16.05 (Up $0.51)
Per day: $1.14 (Up $0.03)
Percent to target (Minimum $18,360 annually – will be increased by 2% yearly): 2.27%
Expenses
Cost to acquire income in 2018: $158.40
Expenses in since the last report: $9.90
Total income added in 2018: $188.31
Profit Margin in 2018: 18.89% (up 0.93%)
** Profit margin is not referring to overall portfolio return. It is a measurement to determine how much dividend income was added compared to the cost of trading fees.
Analysis and Review of Dividend Income added in July 2018
As shown in the chart above, the past month was the lowest month for adding income this year. The business grew $13.30 more since the prior report, and $417.20 in total.
The reason for less income being added was because less capital was deployed. Further, lower yielding positions were acquired.
On a positive note, expenses dropped by $9.90 compared to June. But investment expenses have already surpassed the 2017 total expenses, which is causing the portfolio manager to be more cautious with equity purchases. However, the long term strategy remains the same. As long as dividend income increases more than expenses on a yearly basis, the portfolio has met its objective. The end goal is financial independence through investing.
As of right now the RTC portfolio is earning 18.89% more than its costs.
Concluding Thoughts
To sum up July in a few words, it was an efficient month for the business.
As mentioned above, $13.30 of annual income was added and the portfolio now generates $417.20 worth of passive cash flow per year. New capital was added to 2 core positions that increase dividend payments yearly, and expenses were lower than normal.
After surpassing the goal of $400, it suddenly seems like a small number compared to $500. Now I won’t be happy until $500 annually is reached. Achieving $500 in annual dividend income is somewhat of a milestone because it’s halfway to $1,000. It just makes financial independence seem a lot closer.
Moreover, if the first year of dividend investing was about building the foundation, the second has been about refining the strategy. I anticipate that the benefits of building a cash flow machine will begin to become obvious in years 3 through 5. There will be more capital available to invest from dividend payments, which will cause the dividend snowball to pick up pace.
In conclusion, the benefits of compound interest are just around the corner. Dividend payments are increasing rapidly and payments are finally becoming substantial enough to afford additional shares. As the RTC portfolio moves further in to its 2nd year in operation, more record breaking months are anticipated in the near future.
I am not a licensed investment or tax adviser. All opinions are my own. This post contains advertisements by Google Adsense. This post also contains internal links, affiliate links, links to external sites, and links to RTC social media accounts.
Earn passive income through dividend investing with RTC’s link below ($50 in free trades):

Connect with RTC
Twitter: @Reversethecrush
Pinterest: @reversethecrushblog
Instagram: @reversethecrush_
Facebook: @reversethecrushblog
Email: graham@reversethecrush.com

 Smart Goals for Website Marketing & Dividend Investing
